Getting started#
This document explains how to access your Private Cloud cluster's Managed Kubernetes dashboard and walks you through commonly used sections of your cluster dashboard. It also provides guidance for configuring and running workloads on your Private Cloud cluster.
For an overview of your Managed Kubernetes cluster's default specifications and configuration, see the Managed Kubernetes overview for Private Cloud.
Establishing a secure connection to your cluster#
Your cluster uses Fortigate, Fortinet's Next-Generation Firewall (NGFW), to protect your network and provide remote access services. To access your cluster from your local computer:
Note
These steps assume you're running Linux on your local machine. If you use FortiClient VPN on macOS and Windows, the steps might differ slightly.
- Download and install FortiClient VPN from Fortinet's product download portal. If your local computer uses Red Hat, CentOS, or Fedora, choose the .rpm package. If your computer uses Debian or Ubuntu, choose the .deb package.
-
In your local terminal, open FortiClient VPN:
-
In the left nav of the resulting window, click Remote access.
- Click Configure VPN.
-
On the New VPN Connection page, fill out the configuration form:
- Connection name:
Lambda Cluster - Description:
VPN connection to Lambda Cluster -
Remote Gateway: Create an item for each of your control nodes' public IPs. For each IP, target port 10433 for each as shown in the example below:
- Connection name:
-
Click Save to finish creating your VPN connection profile.
- After setting up your profile, enter your username and password, and then click Connect to log into FortiClient.
You should now have full access to the cluster, as if it were part of your local network.
Accessing your cluster dashboard#
After you establish your FortiClient VPN connection, navigate to https://10.141.3.1 in your browser and then log into your cluster's Rancher dashboard. You can find the login details for your dashboard in your 1Password vault.
Navigating the cluster dashboard#
This section highlights some commonly used components of your cluster's Rancher dashboard. For more guidance on using the Rancher dashboard, see the New User Guides section of the Rancher documentation.
Viewing your cluster#
When you log into the Rancher dashboard, you arrive at a page listing all clusters. In the cluster list, click local, which should be the only cluster in the list. You can also click the bull icon in the left nav to access the cluster.
Managing your nodes#
To see an overview of your nodes, click Cluster in the left nav of your cluster dashboard and then click Nodes. The Nodes page appears.
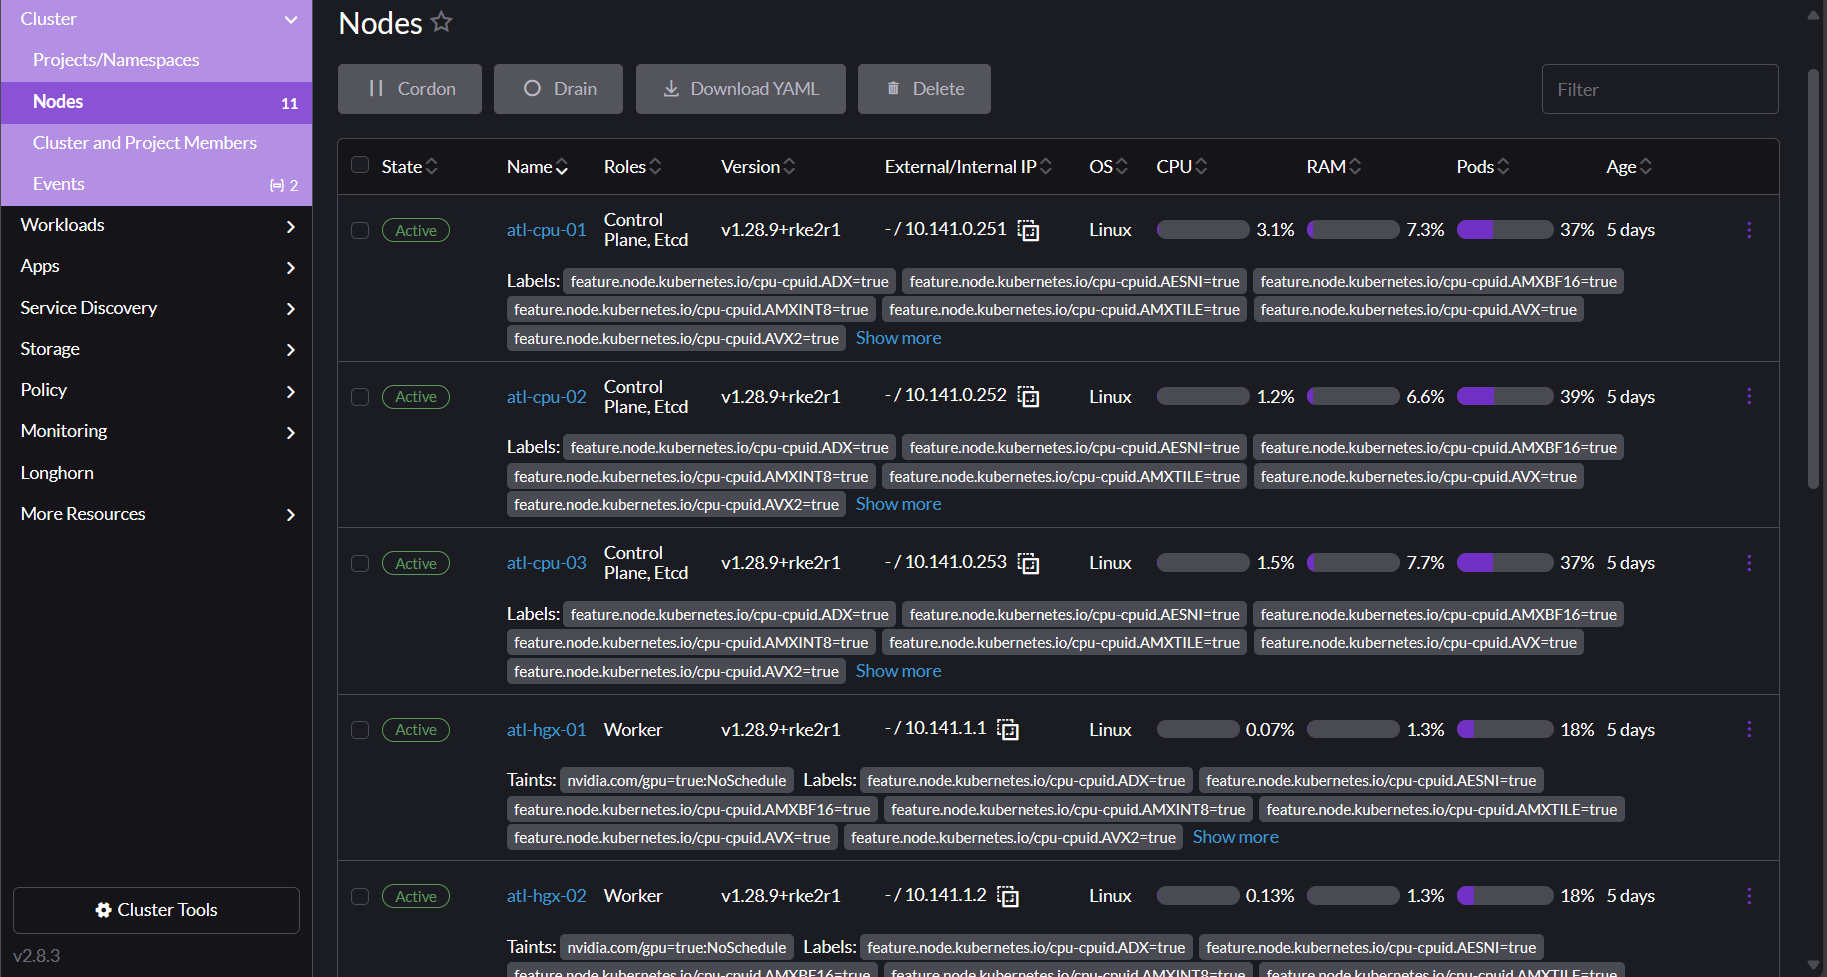
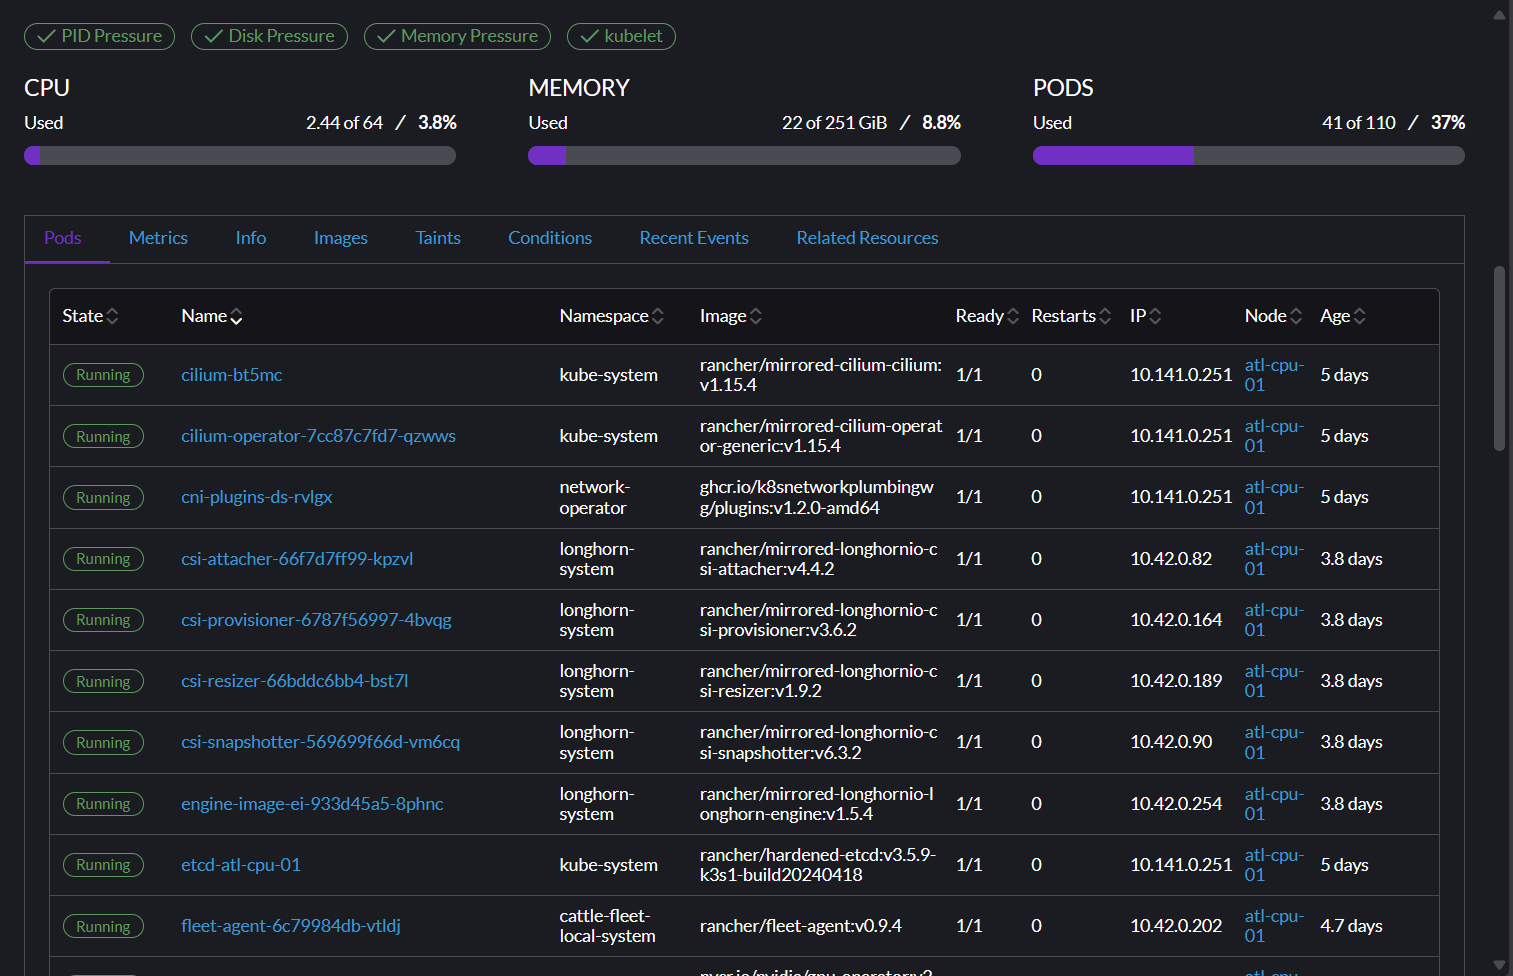
Click a node to see all resources associated with that node. Scroll down past the labels and annotations to see details and metrics for the resources running on your node.
Managing your project resources#
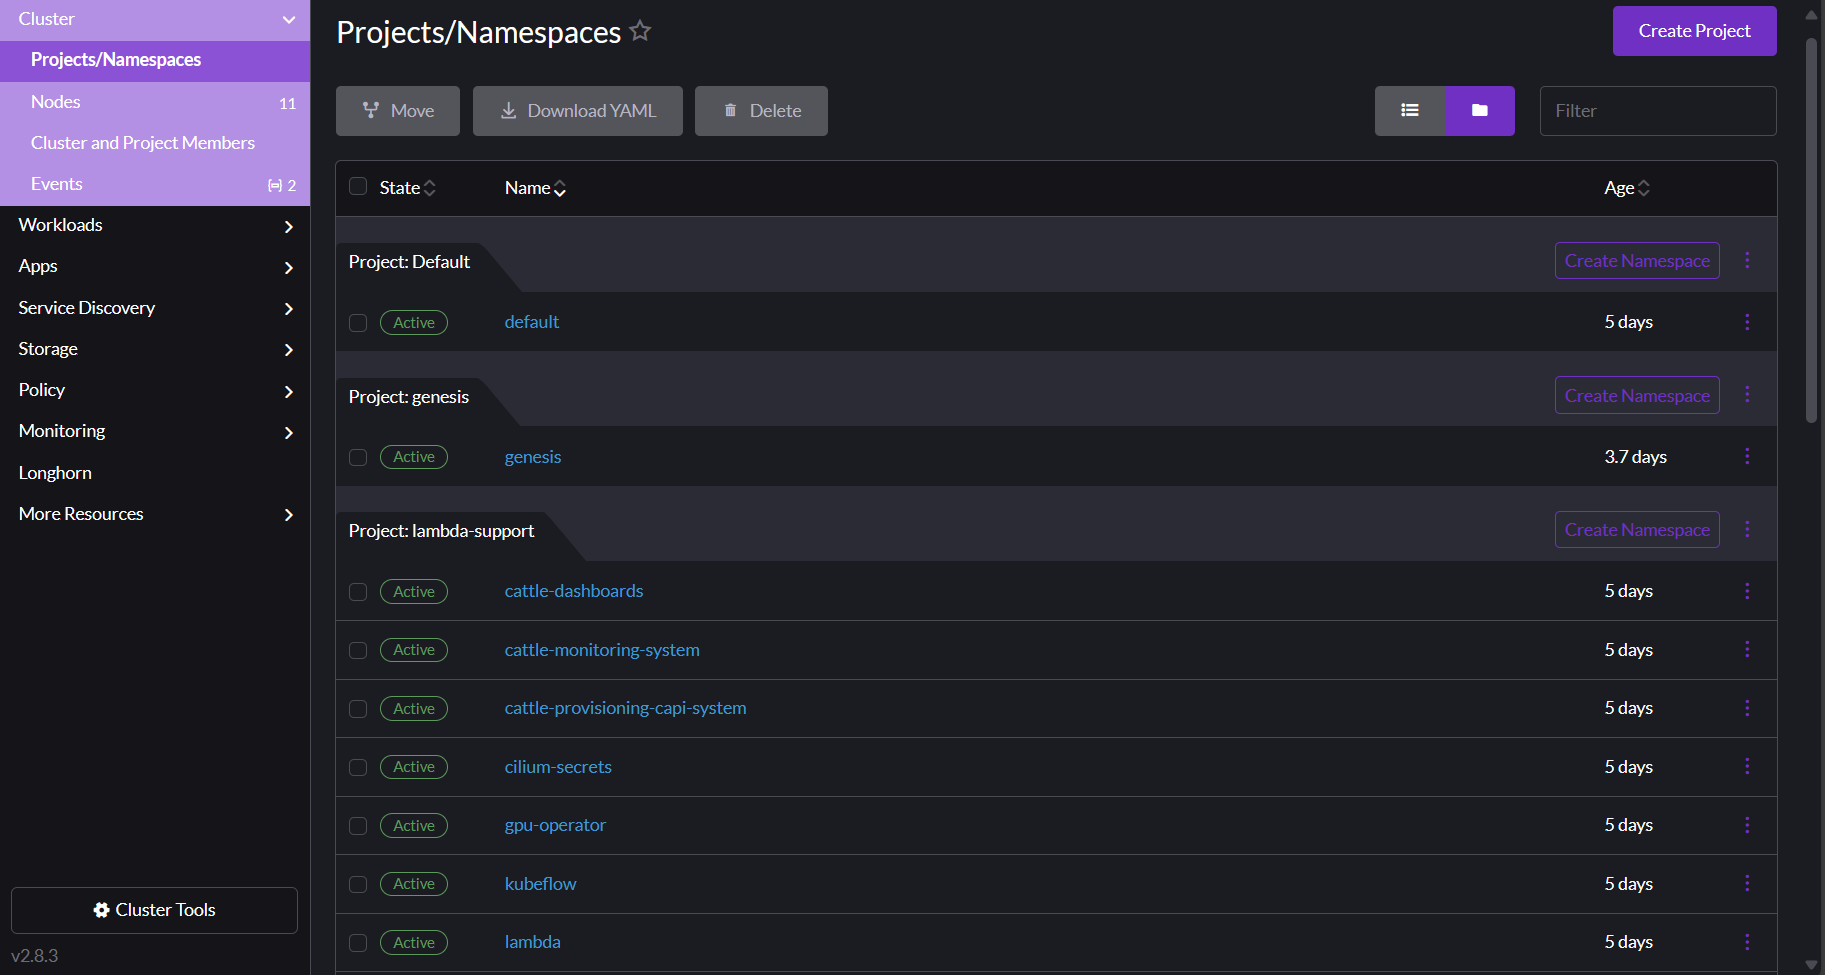
Rancher uses the concept of a project to tie users to clusters and namespaces. When you create a new Private Cloud cluster with Managed Kubernetes, Lambda automatically creates a project and namespace for you that your user owns. You can control all of the resources within this project, including its namespaces.
To view your projects and namespaces, click Cluster in the left nav of your cluster dashboard, and then click Projects/Namespaces. You arrive at the Projects/Namespaces page.
Creating new namespaces#
Because Rancher manages the project/namespace mapping, you must use Rancher to create new namespaces in your project. If you want to automate the creation of new namespaces, you can use the Rancher CLI tool to do so.
Filtering your resources by namespace#
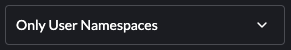
The top bar of the dashboard provides a dropdown filter for projects/namespaces, shown below. You can select multiple items from the list or type to filter the entries then select the appropriate match. The filter applies to every view in the UI.
Managing your workloads#
You interact with your workloads from the Workloads page and its subpages. To access the Workload page, click Workloads in the left nav of your cluster dashboard.
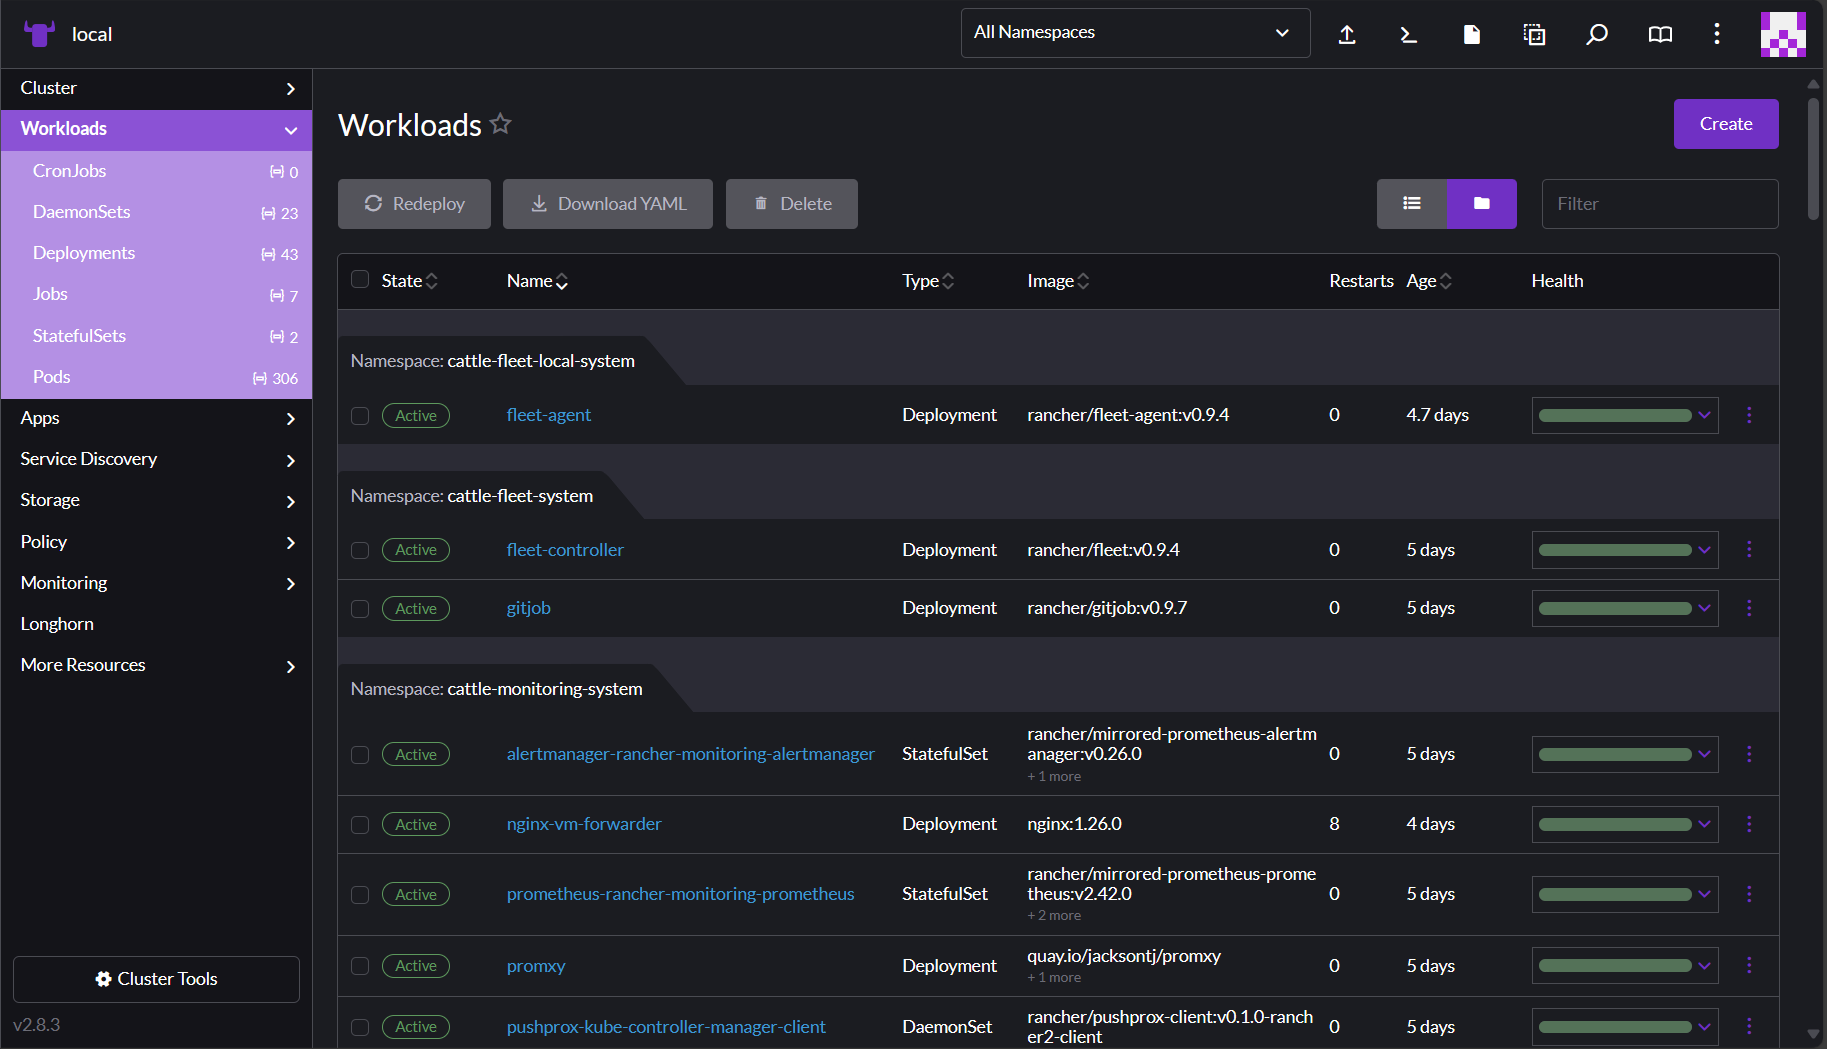
When you click Workloads, the left nav expands to reveal categories for different resource types. The main Workloads dashboard shows all resources and their resource types. You can switch between viewing the table as folders per namespace or viewing it as a flat list by clicking the buttons to the right of the Filter input above the table. You can also filter the view by entering text into the Filter input.
Managing your services#
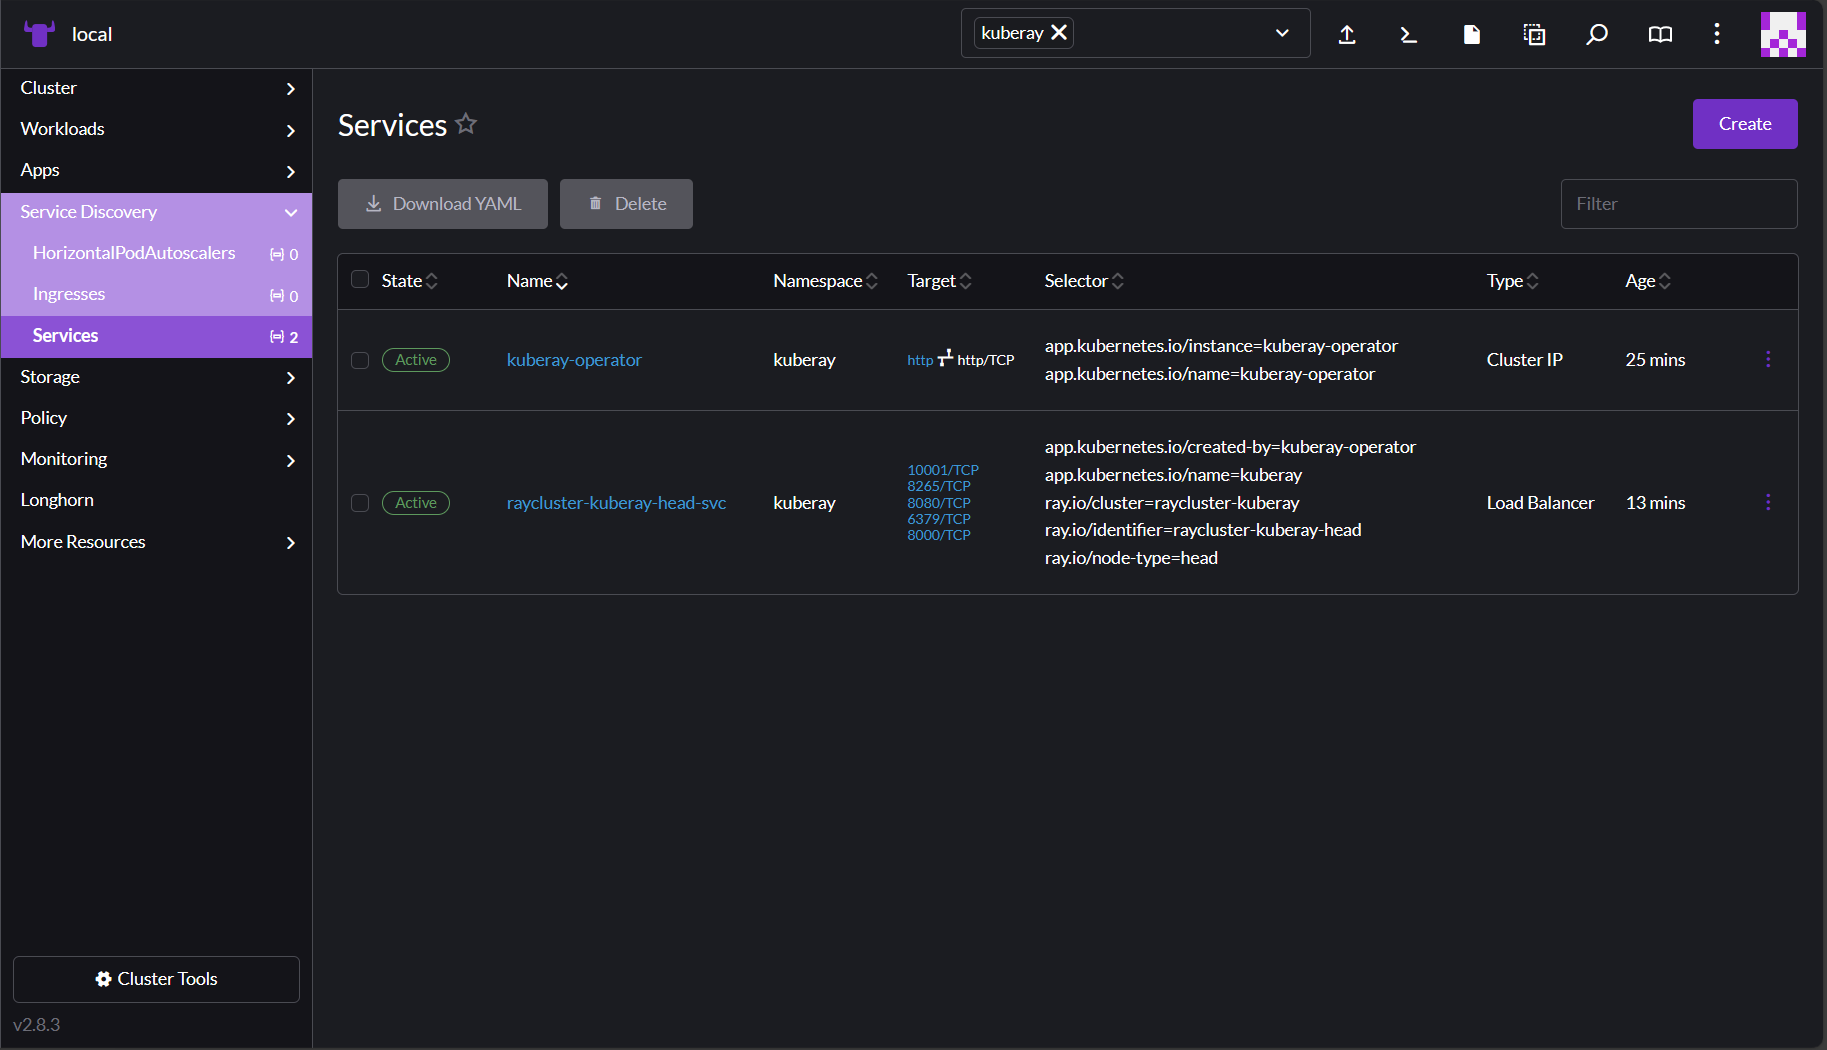
To access services, click Service Discovery in the left nav of your cluster dashboard.
You might find it useful to filter by namespace here, as described in
Managing your project resources above.
For example, in the screenshot below, the Services table has been filtered by
the namespace kuberay. Looking at the namespace, you can see an internal
service of type ClusterIP and an external service of type LoadBalancer. The
Target column contains some details about exposed ports and their names,
if set.
In addition, you can view any ingresses that have been defined by clicking Service Discovery > Ingresses in the left nav.
Monitoring your cluster#
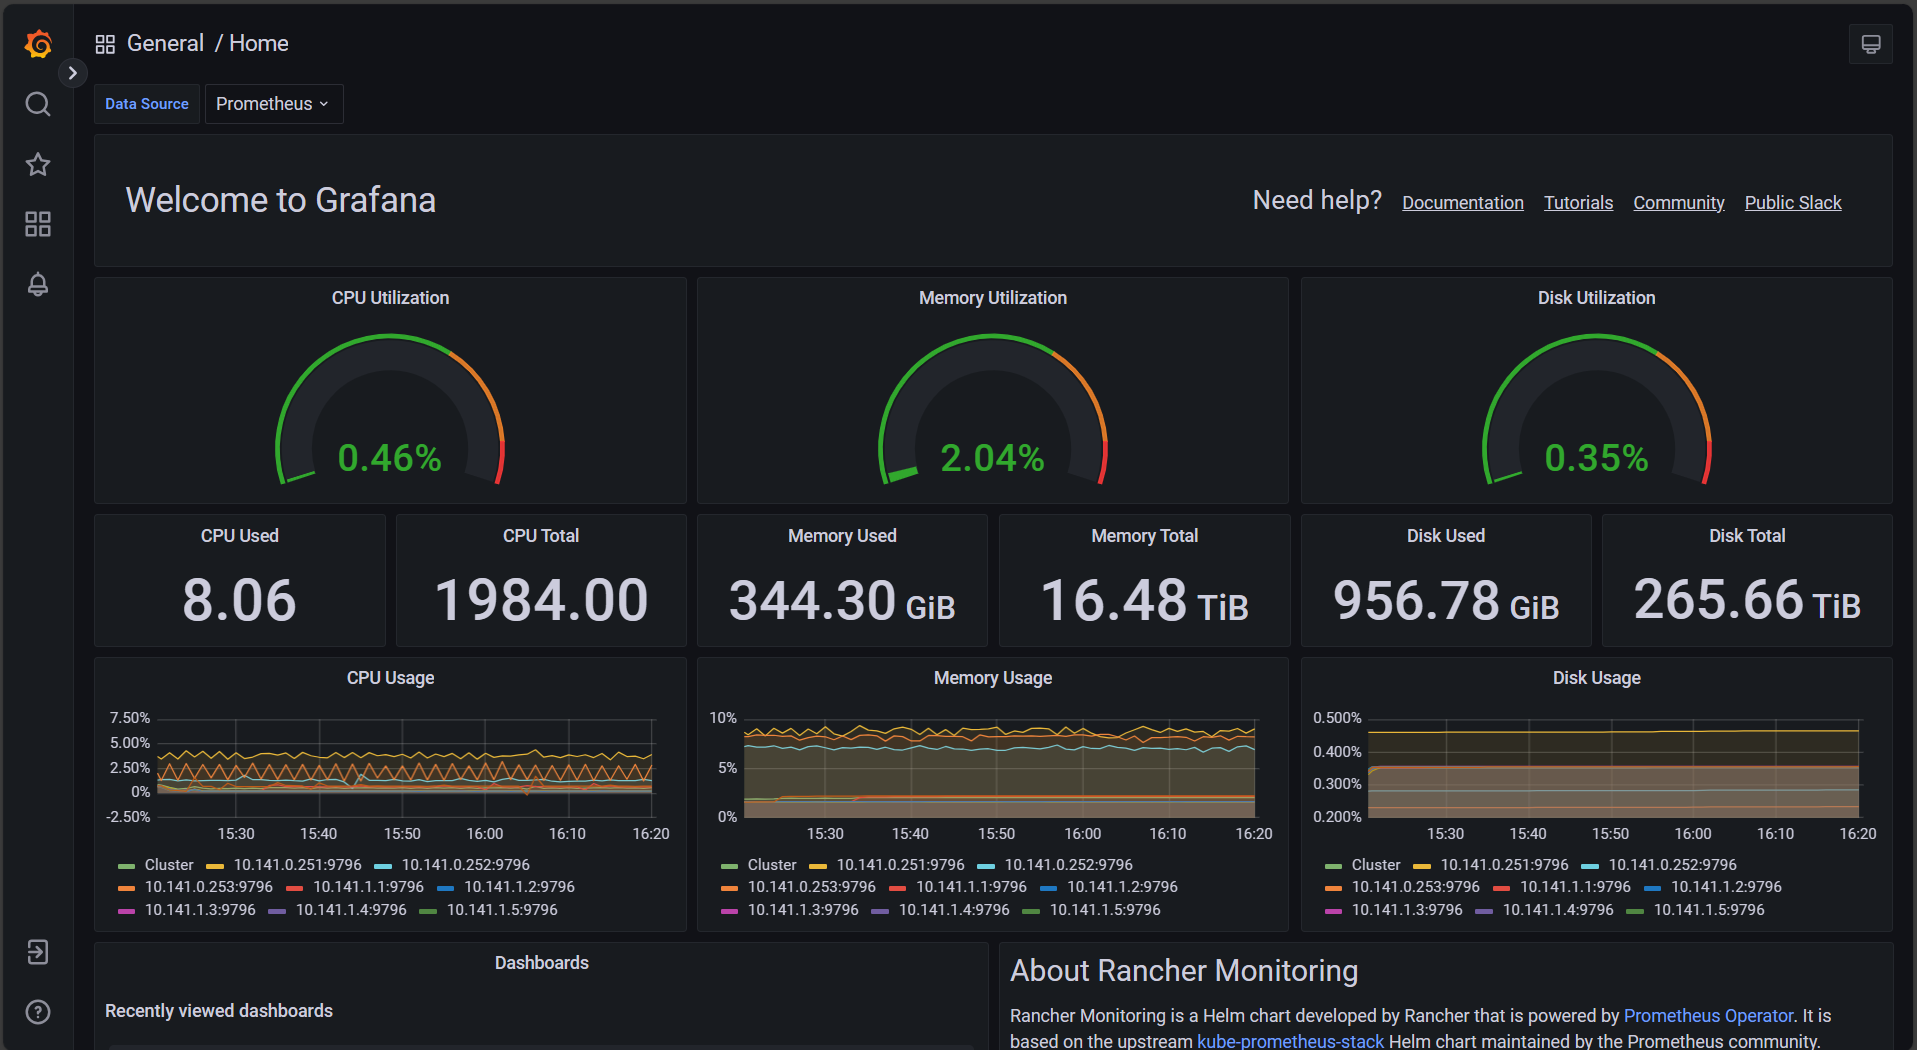
Your cluster uses a high-availability Prometheus configuration. You can view the resulting metrics by visiting your Grafana dashboard. To access the dashboard, click Monitoring in the left nav of your cluster dashboard and then click Grafana.
The main page of the Grafana dashboard covers some basic cluster metrics.
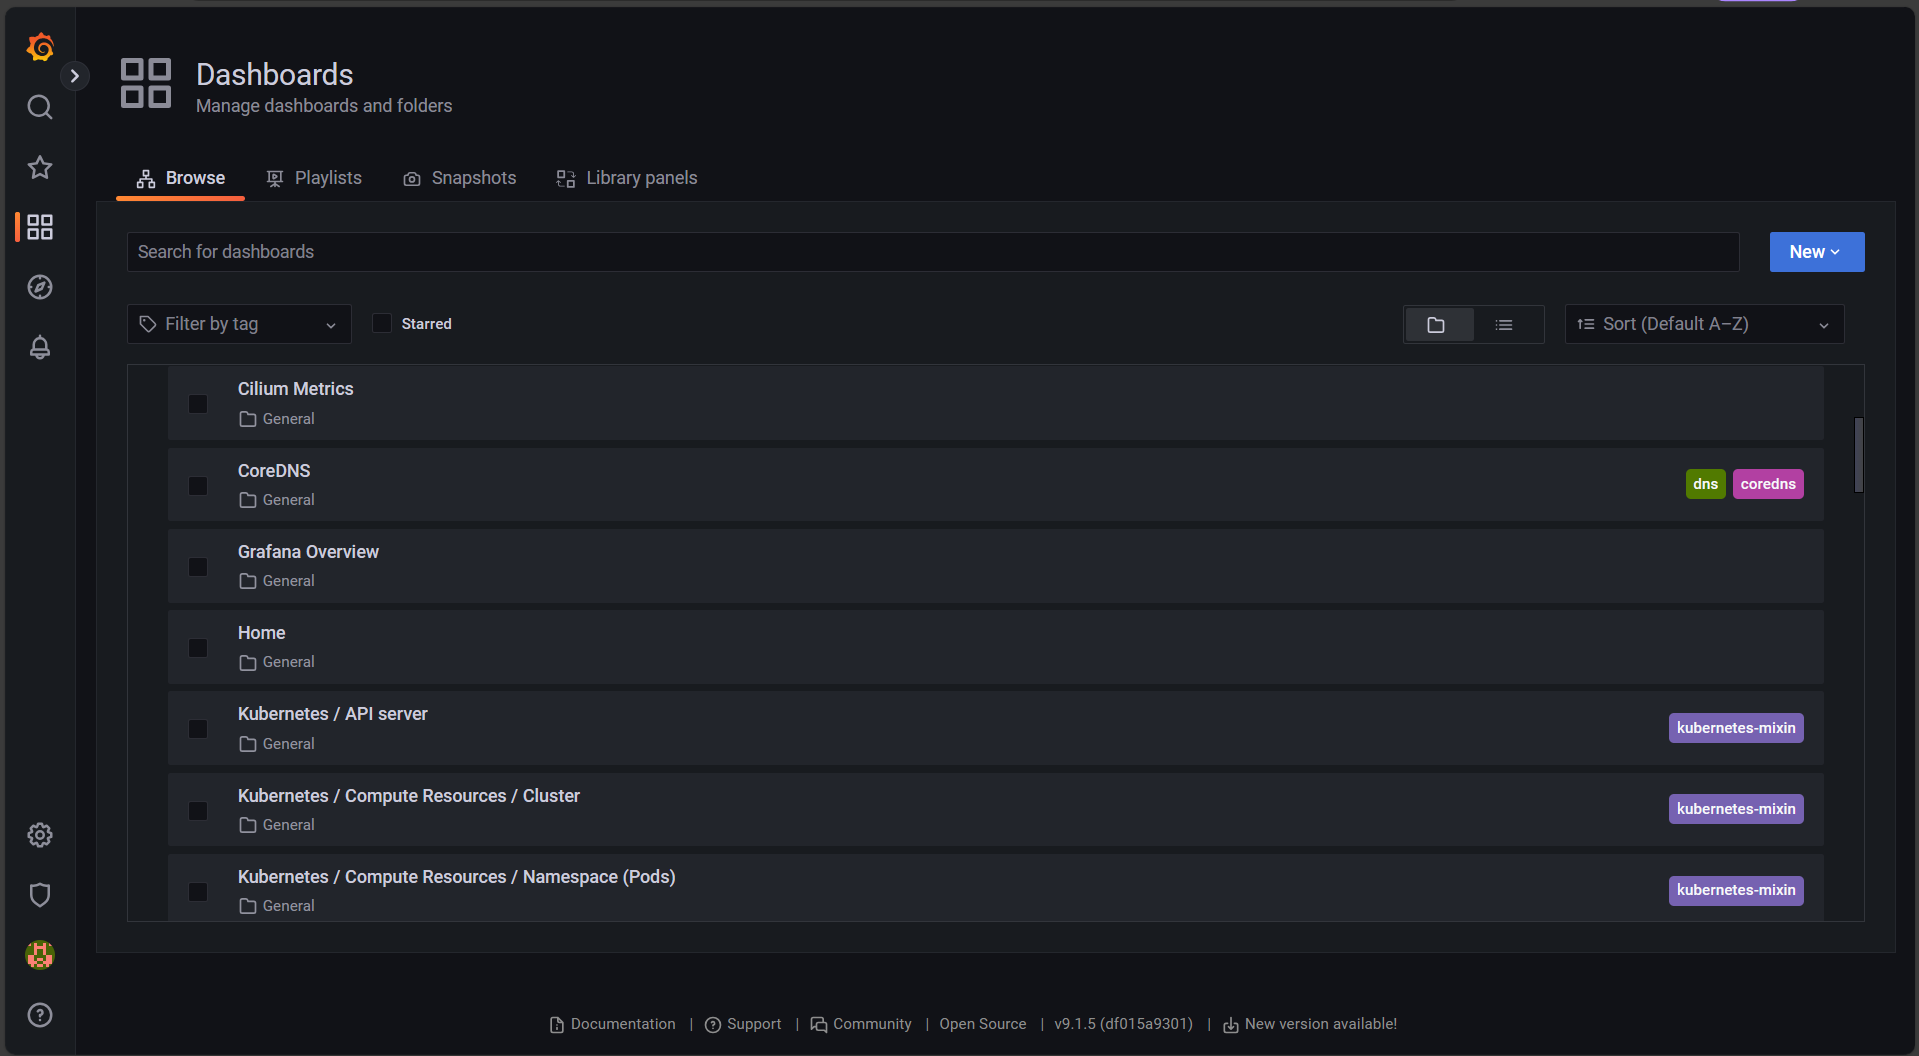
To browse dashboards for other resources, hover over the four-squares icon in the left nav and select Browse.
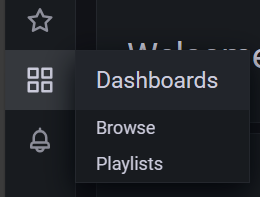
You arrive at a list of available dashboards, as shown in the image below:
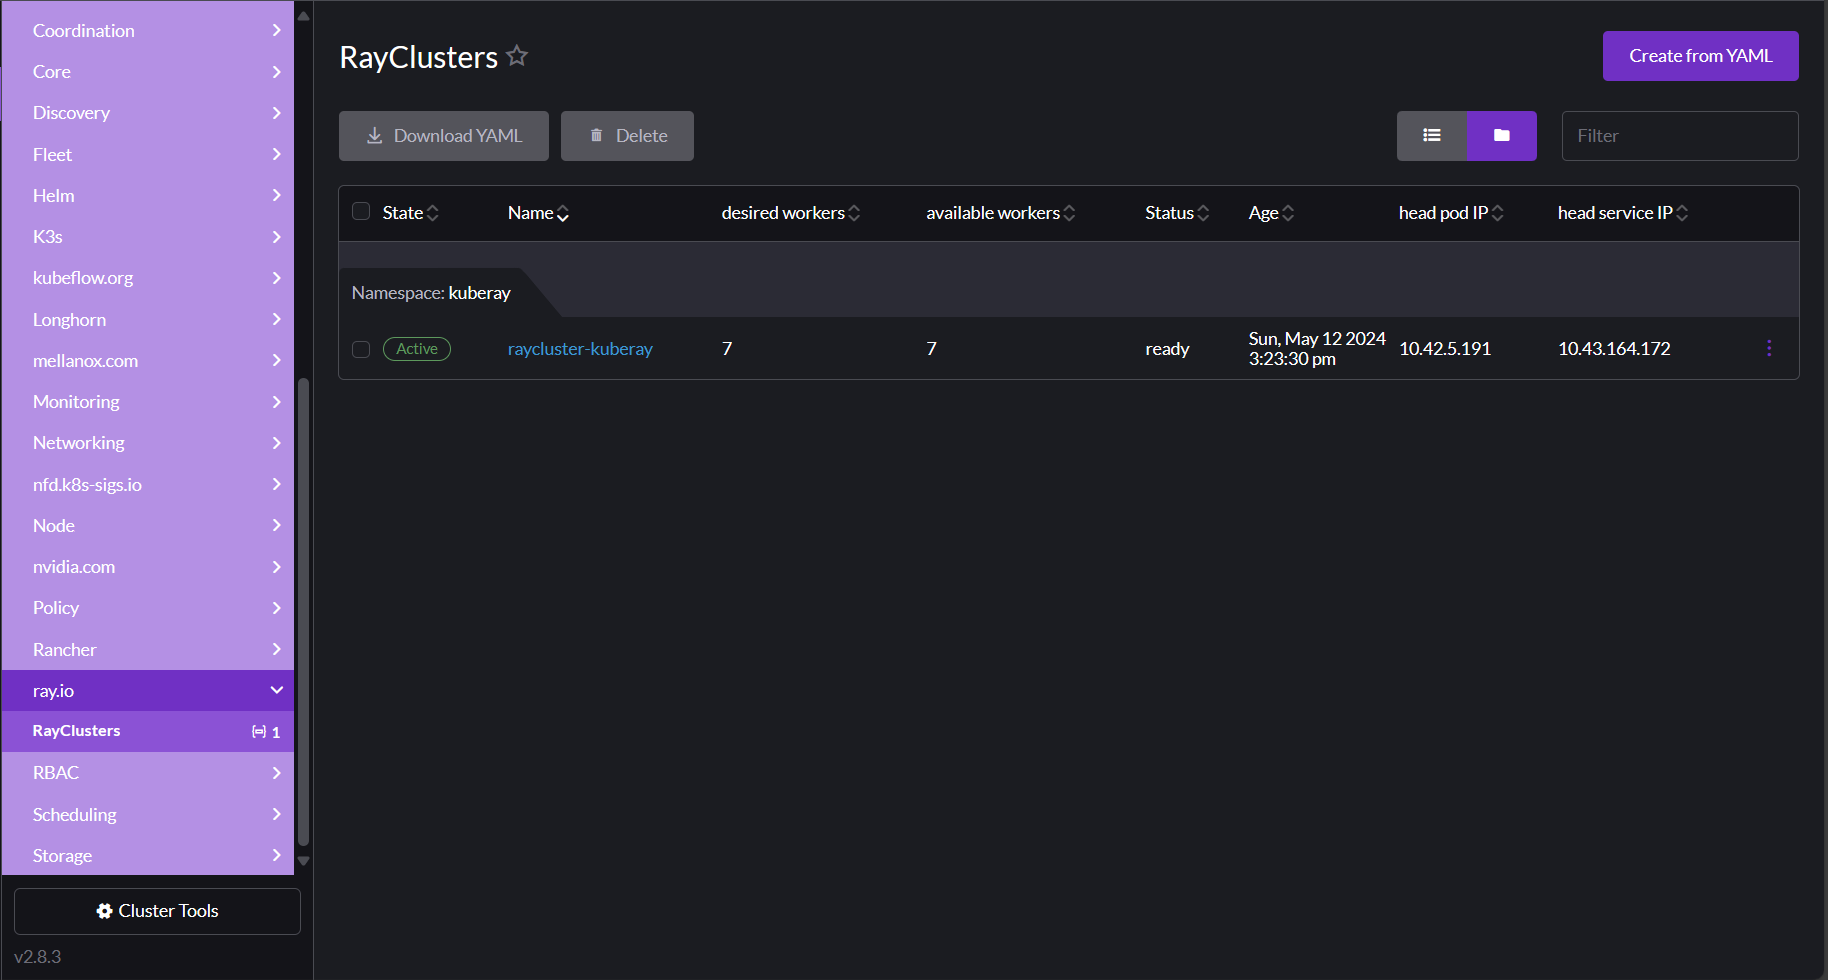
Managing custom resources#
You can view custom resources by clicking More Resources in your cluster's left navigation panel. Your custom resources are grouped by the custom resource definition (CRD) for which they're defined. For example, in the screenshot below, the RayCluster is defined in the ray.io CRD group:
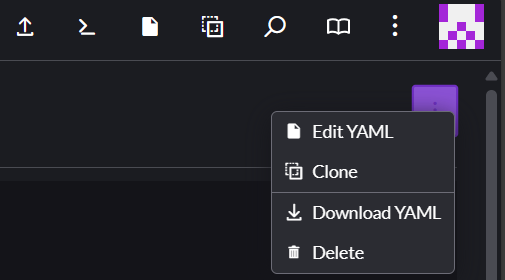
After clicking on the resource in the nav, you can see any CRD-defined statuses or other information it tracks, and then drill down into the resource itself if you need to. Like most resources in the dashboard, you can edit these resources directly by clicking the ⋮ menu in the upper right corner of the resource and then selecting Edit YAML.
Accessing the Kubernetes API#
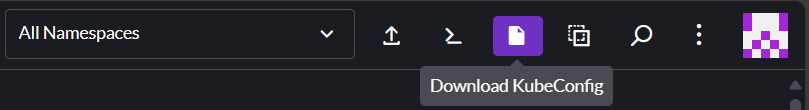
You can access the Kubernetes API at https://10.141.0.250:6443 through your
SSL VPN connection. To download your cluster's kubeconfig file for use with
the API, click the page icon in the top right area of your cluster dashboard:
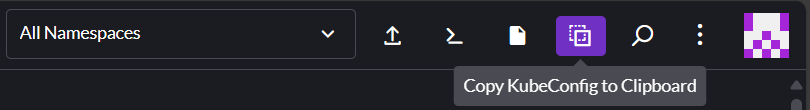
To copy the kubeconfig to your clipboard, click the copy icon in the top
right area of your dashboard.
Configuring your workloads#
Adding tolerations#
Your compute nodes are tainted to restrict what workloads get scheduled on them to maximize the available resources for GPU jobs. The taint applied matches the standard in other CSPs:
As a result, to schedule a workload to your compute nodes, you need to add the following toleration to your deployment, job, or pod specs:
tolerations:
  - key: nvidia.com/gpu
    value: "true"
    operator: Equal
    effect: NoSchedule
# or
tolerations:
  - { key: nvidia.com/gpu, value: "true", operator: Equal, effect: NoSchedule }
Requesting NVIDIA resources#
To allow pods to access your cluster's GPU and Infiniband resources, Lambda deploys the NVIDIA GPU Operator and NVIDIA Network Operator in your cluster. You can request these two operators in your specs as follows:
Note
By default, Lambda configures the NVIDIA Network Operator to deploy a single shared RDMA device. The YAML below reflects this default. You can request a different configuration if needed.