Guest Agent#
Beta Release
The guest agent is currently a Beta release.
Lambda is providing access to the guest-agent before the visualizations are available on lambdalabs.com. The configuration that allows the self-hosted Prometheus and Grafana installations to scrape guest-agent metrics will be removed when the visualizations are fully available on lambdalabs.com. The full release of front-end visualizations will be available some time in 2025.
As this project is Beta, it might contain bugs, incomplete features, and other issues that might affect performance, security, and reliability. We also reserve the right to make breaking changes to the service. Because of these reasons, the guest agent currently should only be used for testing and evaluation.
Please report any bugs you encounter to Lambda's Support team.
Introduction#
lambda-guest-agent is a new service that Lambda provides that is installed on customer VMs. The service collects a number of hardware-level details about VM vitals, such as CPU utilization, GPU utilization, network IO, disk IO, etc and forwards them into a metrics backend for display in visualizations.
The general flow of metrics can be described as such:
flowchart LR
    prometheus[Prometheus]
    FrontEnd[lambdalabs.com]
    subgraph Hypervisor
        subgraph VM
            guestAgent[Guest Agent]
        end

        MetricsForwarder[Lambda Metrics Forwarder]
        MetricsForwarder --> guestAgent

    end
    prometheus -->|Prom HTTP over TCP| MetricsForwarder
    FrontEnd -->|WIP: Front-End Visualizations| prometheus

    style Hypervisor fill:#80808080;
    style VM fill:#80808080;
In this tutorial, you'll install the guest agent and set up Prometheus and Grafana with an example dashboard so you can visualize the collected metrics.
Install the guest agent#
To install the guest agent on an on-demand instance:
First, SSH into your instance by running:
Replace <IP_ADDRESS> with the actual IP address of your instance.
Then, download and install the guest agent by running:
Run the following command to confirm that the guest agent is running:
You should see output similar to the following, indicating that the guest agent is running:
● lambda-guest-agent.service - Lambda metrics and observability agent
     Loaded: loaded (/etc/systemd/system/lambda-guest-agent.service; enabled; vendor preset: enabled)
     Active: active (running) since Mon 2024-10-28 20:58:44 UTC; 18s ago
   Main PID: 68284 (telegraf)
      Tasks: 18 (limit: 271525)
     Memory: 11.5M
        CPU: 572ms
     CGroup: /system.slice/lambda-guest-agent.service
             └─68284 /usr/local/bin/lambda/guest-agent/telegraf -config /etc/lambda/guest-agent/telegraf/telegraf.conf

● lambda-guest-agent-updater.timer - Lambda metrics and observability agent updater
     Loaded: loaded (/etc/systemd/system/lambda-guest-agent-updater.timer; enabled; vendor preset: enabled)
     Active: active (waiting) since Mon 2024-10-28 20:58:44 UTC; 18s ago
    Trigger: Tue 2024-11-05 10:27:09 UTC; 1 week 0 days left
   Triggers: ● lambda-guest-agent-updater.service

Oct 28 20:58:44 192-222-52-58 systemd[1]: Started Lambda metrics and observability agent updater.

● lambda-guest-agent-updater.service - Lambda metrics and observability agent updater
     Loaded: loaded (/etc/systemd/system/lambda-guest-agent-updater.service; enabled; vendor preset: enabled)
     Active: active (exited) since Mon 2024-10-28 20:58:50 UTC; 12s ago
TriggeredBy: ● lambda-guest-agent-updater.timer
    Process: 68290 ExecStart=/bin/bash /usr/local/bin/lambda/guest-agent/guest-agent-update.sh (code=exited, status=0/SUCCESS)
   Main PID: 68290 (code=exited, status=0/SUCCESS)
        CPU: 4.845s
Set up Prometheus and Grafana#
Lambda is providing access to guest-agent before metrics are available on LambdaLabs.com. Until that is available, these are steps you can follow to self-host a Prometheus and Grafana installation to get access to the guest-agent metrics.
To set up Prometheus and Grafana:
-
SSH into one of your nodes:
Port Forwarding
The
-L 3000:localhost:3000argument specifies to SSH that it should open a tunnel for port3000. This will be used for logging into Grafana. This port must be open any time you want to connect to Grafana. -
Clone the Lambda Labs guest-agent repo and change into the
guest-agent/prometheus-grafanadirectory by running: -
Obtain the IP address of your instances.
Use the private IP addresses for your cluster as listed on cloud.lambdalabs.com. When installing Prometheus+Grafana for a 1CC installation, note that the GPU nodes are not publicly routable and can only be accessed from a head node. Because of this, it's recommended to install Prometheus+Grafana directly on a head node and use the private IP addresses as listed on your 1CC status page.
Use the public IPs of your On-Demand instances if you desire to collect metrics from more than one instance. This means that the node where you install Prometheus must be able to contact other nodes on port
9101, which may mean opening a firewall rule. See the section below for more details. -
Edit the
prometheus/prometheus.ymlfile.Under
targets:, changelocalhost:9101to<PRIVATE_IP_ADDRESS>:9101.Replace
<PRIVATE_IP_ADDRESS>with the private IP address of your instance, which you obtained in the previous step.In the
prometheus.ymlfile, thescrape_configskey should look like: -
Edit the
compose.yamlfile and setGF_SECURITY_ADMIN_PASSWORDto a strong password. -
Start Prometheus and Grafana containers on your instance by running:
-
In your web browser, go to http://localhost:3000 and log into Grafana. For the username, enter
admin. For the password, enter the password you set earlier. -
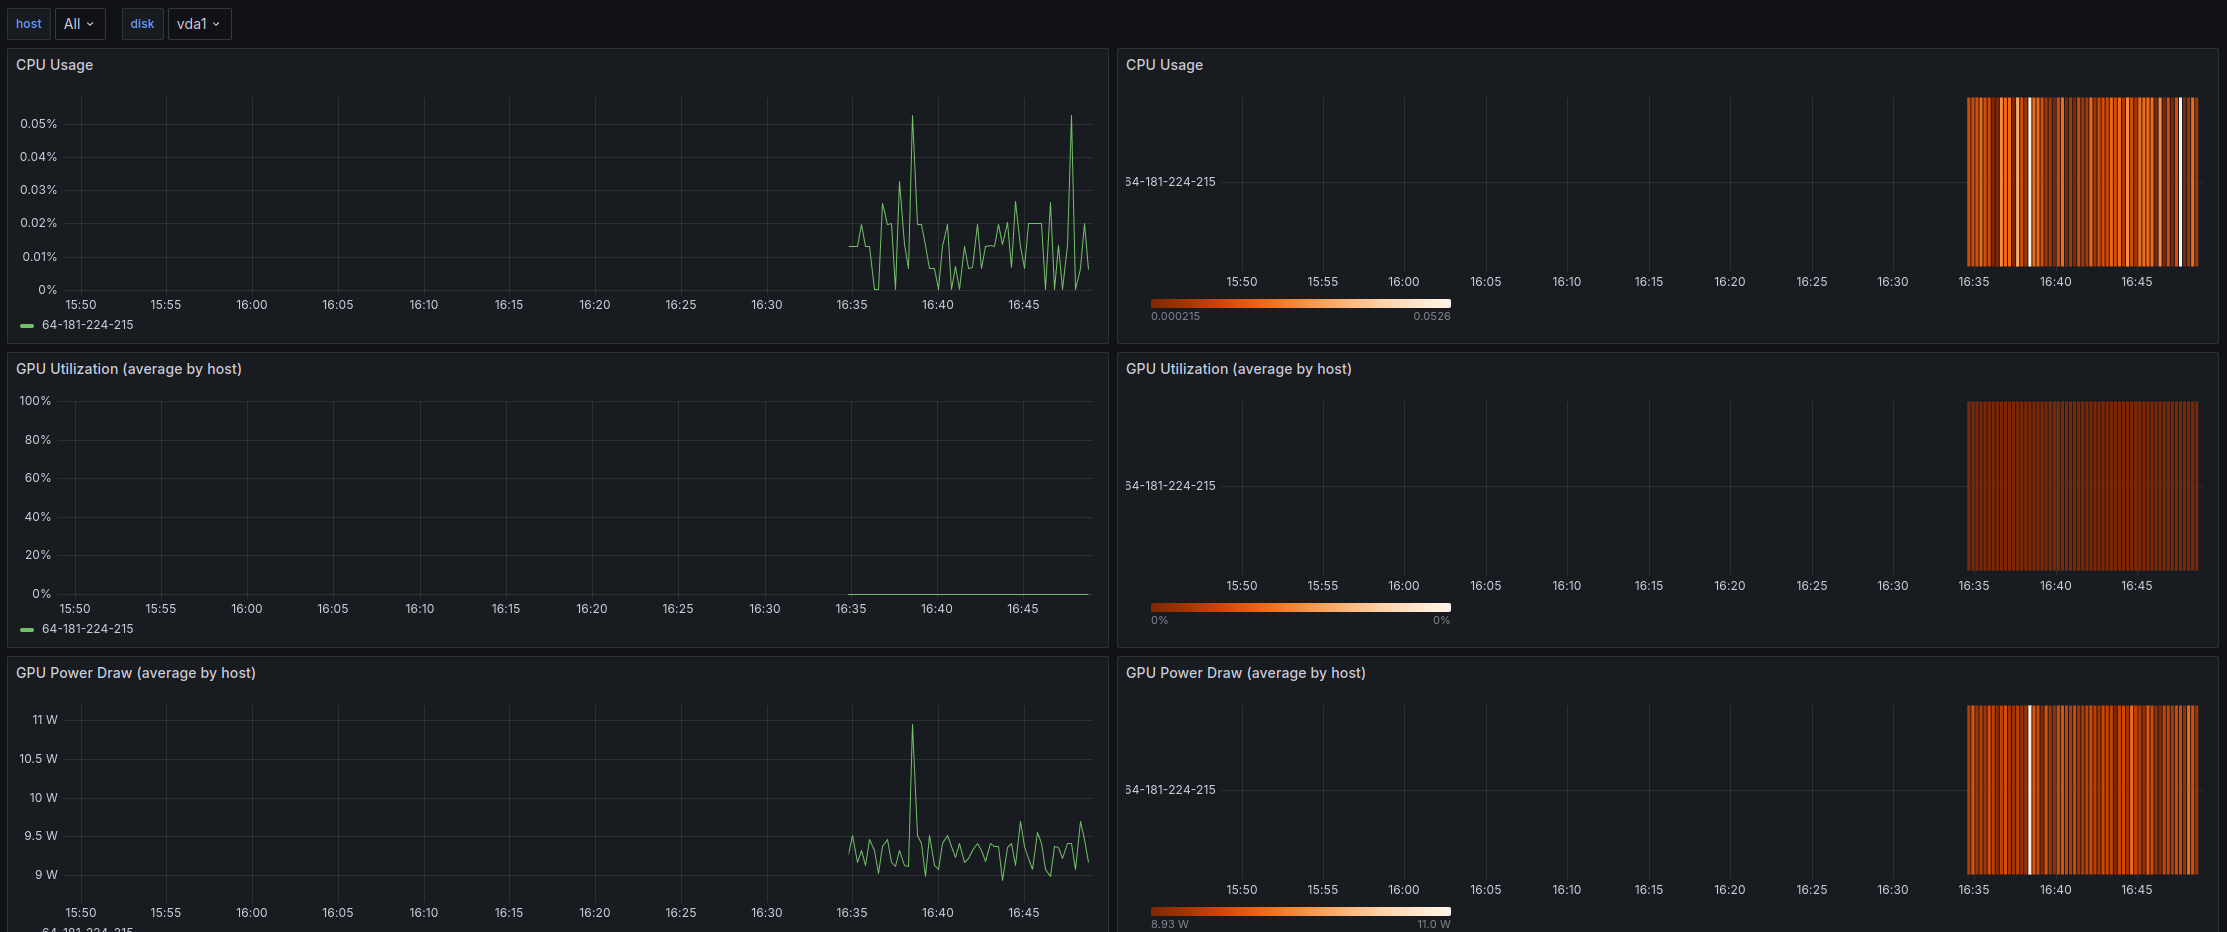
You'll see a Grafana dashboard displaying:
- CPU usage
- GPU utilization
- GPU power draw
- InfiniBand transfer rates
- local storage transfer rates
Note
On-demand instances, unlike 1-Click Clusters, don't use InfiniBand fabric. Accordingly, the InfiniBand transfer rates will always be zero.
Security#
During the public beta release of guest-agent, the service exposes a Prometheus
listener on 0.0.0.0:9101. As mentioned before, this listener is a temporary
measure to allow customers to gain access to metrics before they are available
on lambdalabs.com. The
sections below describe the implications of this listener for our public cloud
products.
1CC#
Compute nodes in 1-Click-Clusters are not capable of accepting connections from
the public internet. Consequently, the 0.0.0.0:9101 listener can only be queried
from your head nodes. When self-hosting Prometheus and Grafana, it's recommended
to install them on one of your head nodes. This way, no tunnels are required to
access guest-agent metrics.
On-Demand#
When installed on an on-demand node, guest-agent metrics can only be queried after exposing them either through an SSH tunnel (as described in Install the guest agent), or by opening up a hole in the Lambda firewall to accept connection requests to port 9101. It is NOT recommended to open up the firewall, as guest-agent is not configured for TLS nor for any sort of authorization. Thus, an SSH tunnel is the safest route as encryption and authorization can be done through the SSH protocol.
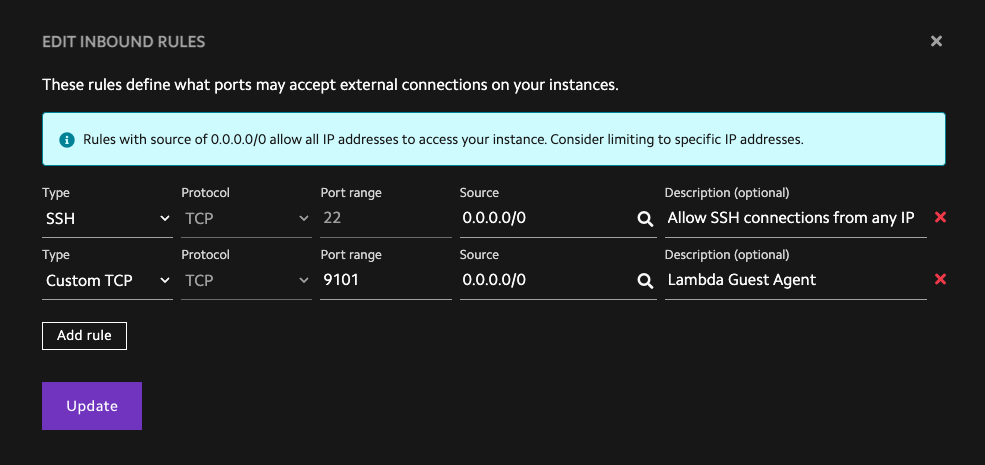
If you decide that opening guest-agent to the firewall is acceptable, you can do
so by selecting the Firewall tab in your cloud dashboard
and adding a rule that looks like this:
Data Privacy#
Lambda takes your data privacy seriously. When you install guest-agent, we forward your metrics to our internal metrics infrastructure. Lambda does not store any personally identifying information in our metrics backend. The only customer-specific identifiers we store is a unique ID that will only be used to allow lambdalabs.com to gather your specific data once visualizations are available there. We do not store names, email addresses, street addresses, billing information, VM hostnames, or any other personally-identifying information on our metrics backend beyond what is necessary to serve your data to you.
Updates#
The guest-agent will automatically update itself on a two-week cadence. You may disable
updates by stopping and disabling the lambda-guest-agent-updater.timer systemd unit:
sudo systemctl stop lambda-guest-agent-updater.timer
sudo systemctl disable lambda-guest-agent-updater.timer
Disablement#
Furthermore, you may disable the guest-agent entirely by removing the guest-agent apt package. Upon removal, the package will stop disable all services:

