Installing the guest agent and getting started with Prometheus and Grafana#
Introduction#
Note
The guest agent is currently an alpha release. The guest agent is under active development and might contain bugs, incomplete features, and other issues that might affect performance, security, and reliability. The guest agent currently should only be used for testing and evaluation.
The guest agent currently shouldn't be used in production environments.
Please report any bugs you encounter to Lambda's Support team .
You can install the guest agent on your Lambda Public Cloud on-demand instances to gather metrics such as GPU and CPU utilization.
In this tutorial, you'll install the guest agent and set up Prometheus and Grafana with an example dashboard so you can visualize the collected metrics.
Install the guest agent#
To install the guest agent on an on-demand instance:
First, SSH into your instance by running:
Replace IP-ADDRESS with the actual IP address of your instance.
Note
The -L 3000:localhost:3000 option enables local port forwarding. Local
port forwarding is needed to access the Grafana dashboard you'll create
in a later step. See the SSH man page to learn
more.
Then, download and install the guest agent by running:
Set up Prometheus and Grafana#
To set up Prometheus and Grafana:
-
Clone the Awesome Compose GitHub repository and change into the
awesome-compose/prometheus-grafanadirectory by running: -
Obtain the private IP address of your instance by running:
-
Edit the
prometheus/prometheus.ymlfile.Under
targets, changelocalhost:9090toPRIVATE-IP-ADDRESS:9101.Replace
PRIVATE-IP-ADDRESSwith the private IP address of your instance, which you obtained in the previous step.Note
Make sure you're changing both the host and the port. It's frequently overlooked that the port is being changed as well as the host.
In the
prometheus.ymlfile, thescrape_configskey should look like: -
Edit the
compose.yamlfile and setGF_SECURITY_ADMIN_PASSWORDto a strong password. -
Start Prometheus and Grafana containers on your instance by running:
-
In your web browser, go to http://localhost:3000 and log into Grafana. For the username, enter
admin. For the password, enter the password you set earlier. -
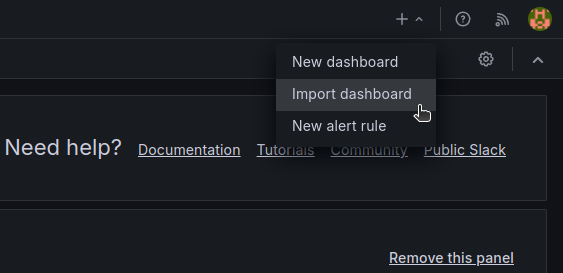
At the top-right of the dashboard, click the +. Then, choose Import dashboard.
-
In the Import via dashboard JSON model field, enter the example JSON model prepared for this tutorial, then click Load. In the following screen, click Import.
-
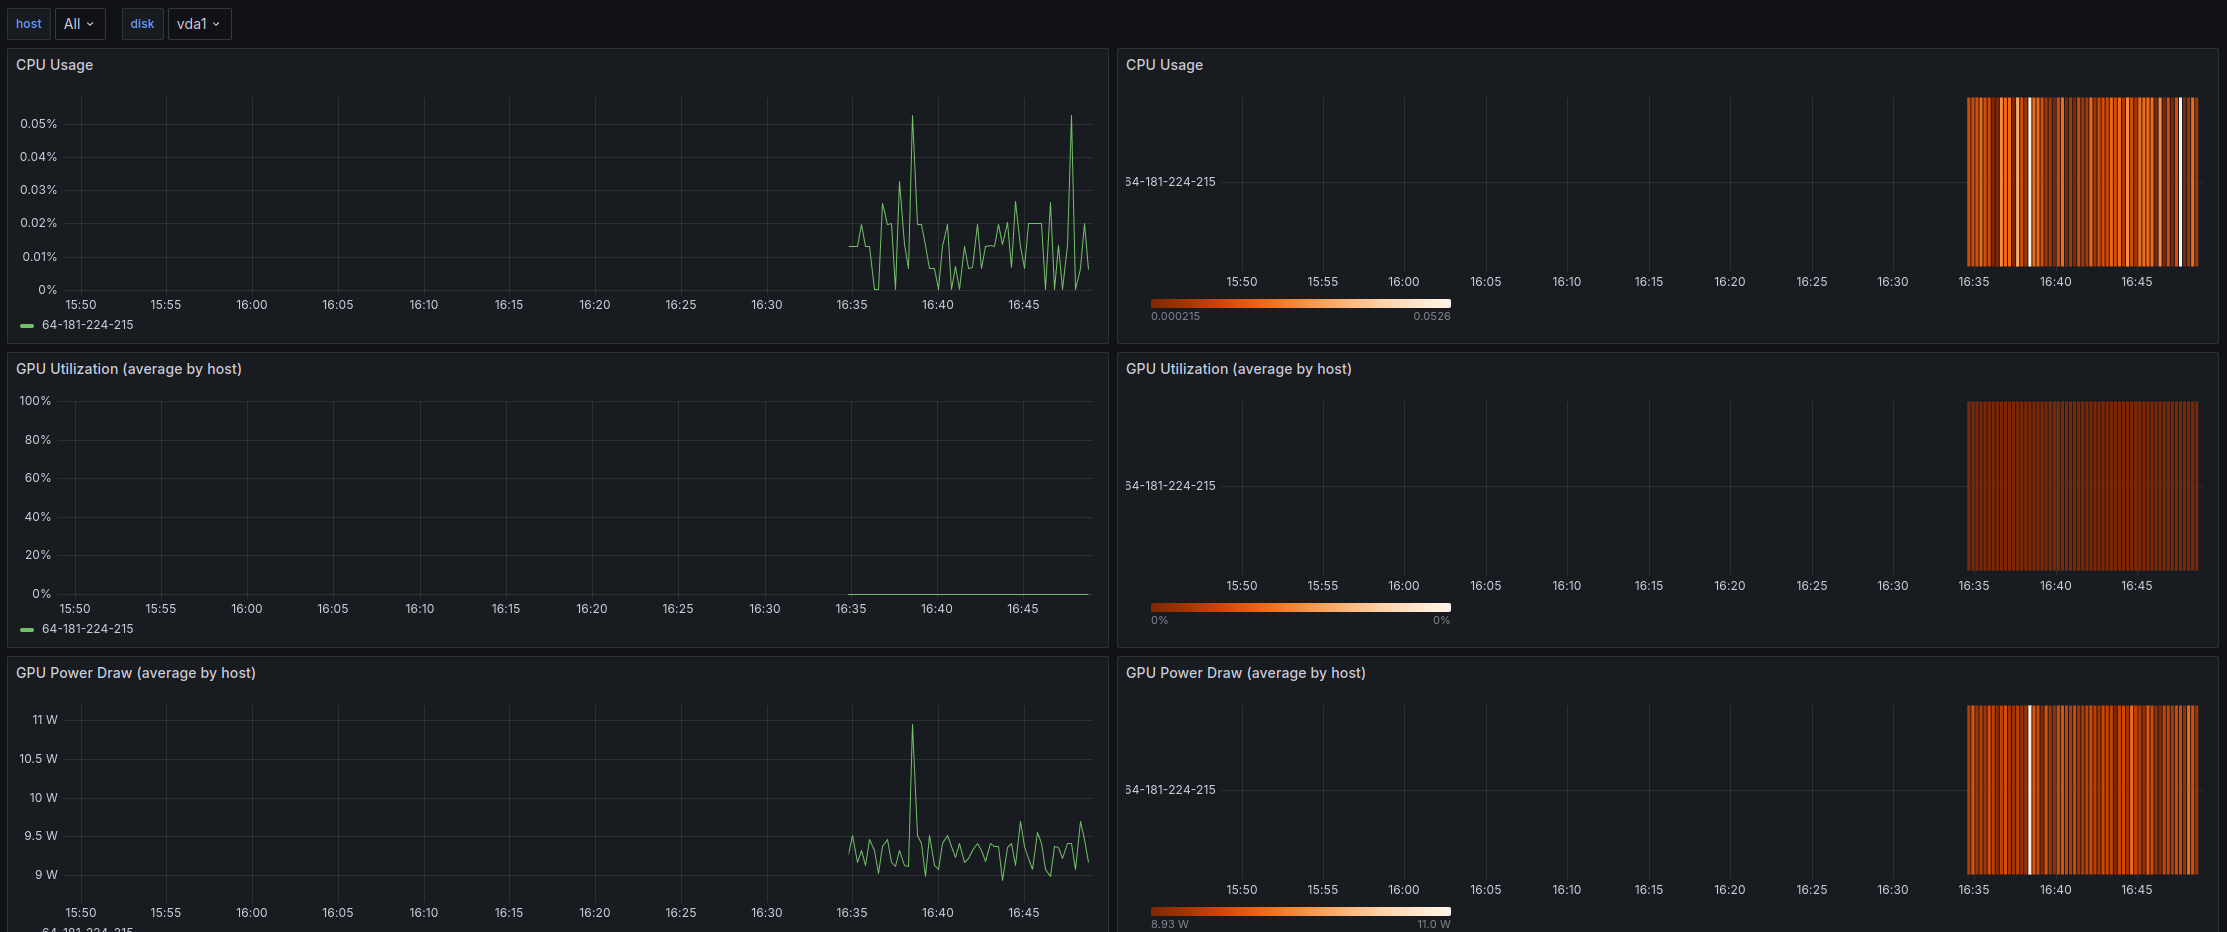
You'll see a Grafana dashboard displaying:
- CPU usage
- GPU utilization
- GPU power draw
- InfiniBand transfer rates
- local storage transfer rates
Note
On-demand instances, unlike 1-Click Clusters, don't use InfiniBand fabric. Accordingly, the InfiniBand transfer rates will always be zero.